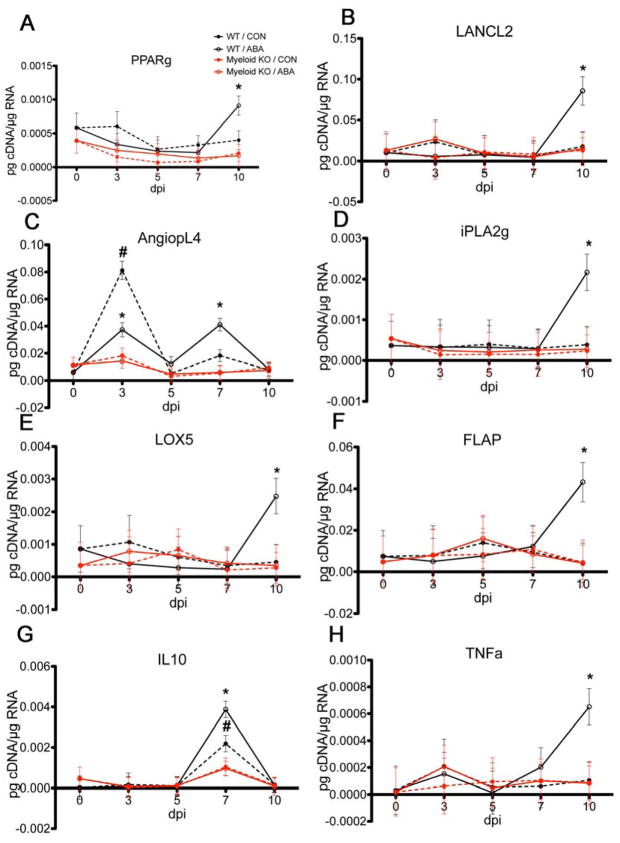
Figure 6.
Effect of ABA treatment on pulmonary gene expression following infection with influenza virus.(A) PPAR γ, (B) LANCL2, (C) angiopoietin-like 4, (D) iPLA2, (E) LOX5, (F) FLAP, (G) IL-10 and (H) TNF-α. WT or myeloid KO mice were challenged with 5 × 10⁴ TCID50 of influenza A/Udorn (H3N2) and then treated with either PBS or ABA (100 mg/ABA kg body weight) by oral gavage for 10 days. Asterisks denote statistically significant differences between the ABA-treated WT and the myeloid KO mice. Pound signs denote statistically significant differences between the ABA-treated WT and the control WT (n=10 mice per treatment and genotype).

