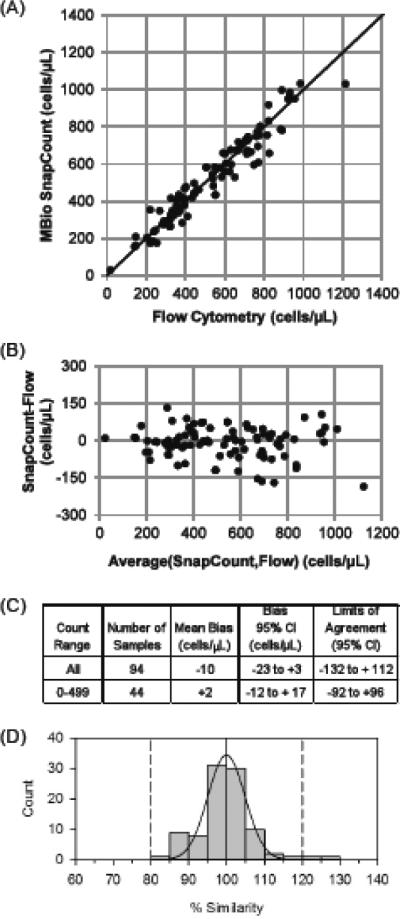
FIGURE 1. SnapCount™ performance with venous blood samples.
(A) Scatter plot of SnapCount™ versus FACSCalibur CD4 cell counts. The solid line is the identity line. (B) Bland-Altman plot comparing SnapCount™ and FACSCalibur. (C) Bland-Altman parameters. (D) Histogram for percentage similarity (%SIM) of SnapCount™ and FACSCalibur. The solid curve is a normal distribution fitted to the histogram, which yields a %SIM of 99.8% ± 7.3% and a 7.3%SIM CV.

