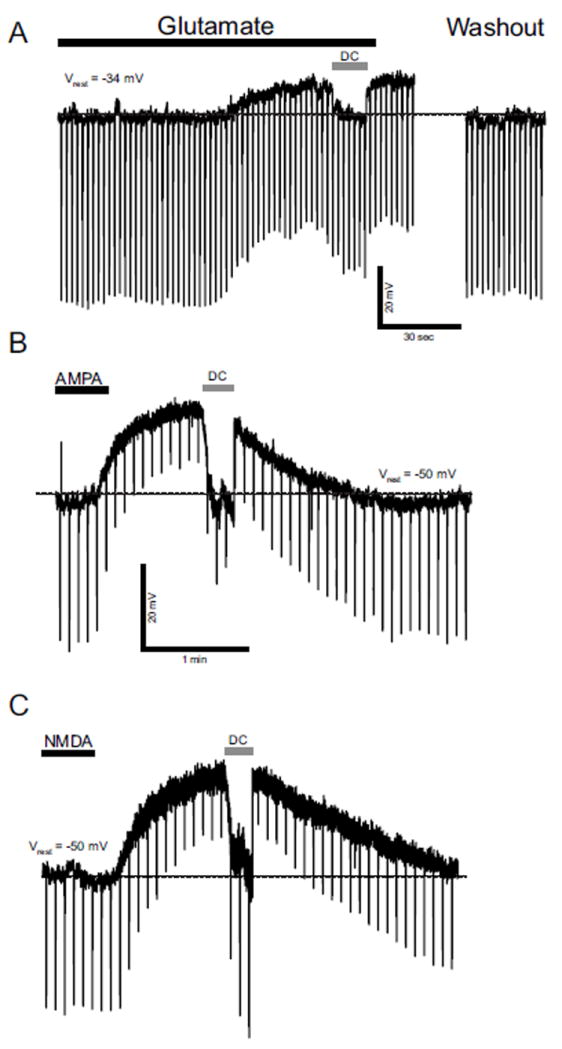
Fig. 2.

A: Responses to glutamate, E14 neuron. This neuron responded to 0.5 mM glutamate with depolarization. Hyperpolarizing current pulses were injected to monitor change in Rinput. Vm was restored to Vrest level (dashed line) with constant DC current (DC) for calculation of change in Rinput. In this neuron, glutamate decreased Rinput. B and C: Response to glutamate receptor agonists NMDA and AMPA, E20 rNST neuron. This neuron responded to (B) 10 μM AMPA and (C) 100 μM NMDA with membrane depolarization. AMPA and NMDA decreased and increased Rinput respectively. Black bars above traces indicate timing and duration of the drug application. Dashed lines indicate Vrest level.
