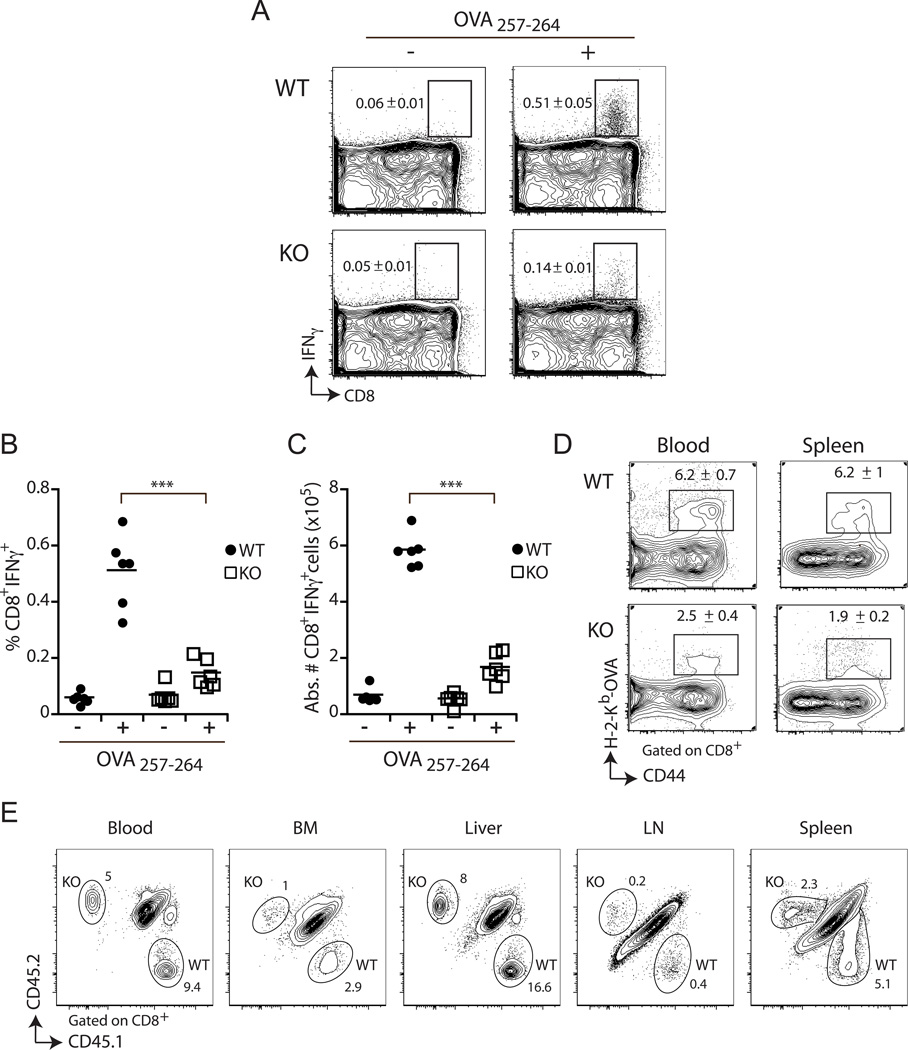
Figure 1. Def6 deficiency results in defective CD8+ T cell primary expansion.
A–D, Mice were challenged and Ag-specific CD8+ T cell response in the spleen and blood was assayed 7 days later by IFN-γ ICS after 5h of ex vivo restimulation in the presence (+) or absence (−) of the OVA257–264 peptide (A–C) and OVA257–264/Kb tetramer staining (D). Representative FACS plots (A), frequency (B) and absolute number (C) of IFN-γ-producing wild-type (WT) and Def6−/− (KO) CD8+ T cells present in the spleen (n=6 per group) is shown. Numbers shown in the FACS plots are the percentage ± SEM for each group of mice. Dots and squares represent individual mice, and means ± SEM are indicated. ***P<0.0005 (two-tailed unpaired t-test). D, Representative FACS plots of WT and KO Ag-specific CD8+ T cells present in the blood and spleen. Numbers shown in the FACS plots are the percentage ± SEM for each group of mice. E, Five hundred naïve WT (CD45.1+) and Def6−/− (KO; CD45.2+) OT-I CD8+ T cells (expressing an OVA-specific TCR) were adoptively co-transferred into CD45.1/2+ B6 recipient mice that were immunized one day later with 5 × 10⁶ Act-mOVA/Kb−/− splenocytes followed by flow cytometry analysis at day 7. The frequency of WT and KO OT-I CD8+ T cells among the lymphocytes from the blood, bone marrow (BM), liver, lymph node (LN) and spleen is indicated. Data are representative of five independent experiments.

