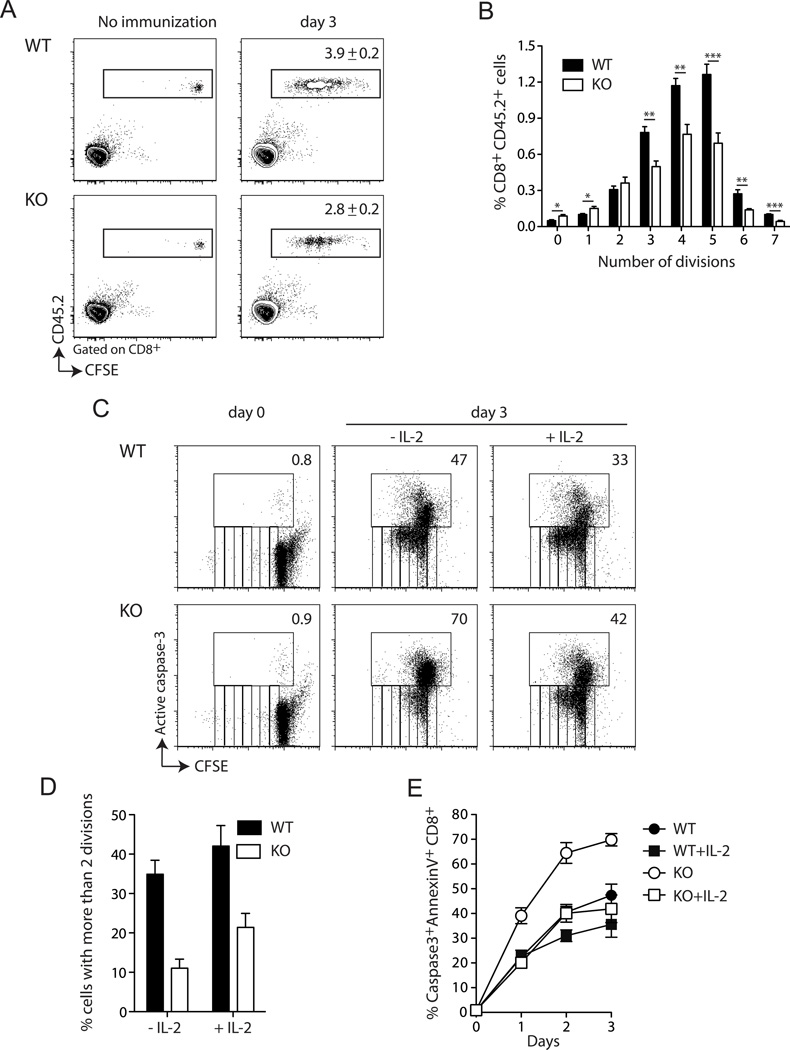
Figure 4. SLAT is required for proliferation and IL-2-dependent survival of CD8+ T cells.
Five × 105 WT or KO (CD45.2+) OT-I CD8+ T cells were labeled with CFSE and injected i.v. into naïve B6.SJL (CD45.1+) mice. One day later, the mice were immunized with 5 × 10⁶ Act-mOVA/Kb−/− splenocytes. Splenocytes were harvested 3 days later, and the proliferation of OT-I cells was analyzed by FACS analysis of CFSE dilution after gating on live CD8+ T cells. A, Numbers in the right panels indicate the % of WT or KO OT-I CD8+ T cells among CD8+ splenocytes (mean ± SEM of 6–7 mice). B, Frequency of OT-I cells at each cell division cycle. *P<0.05, **P<0.005, ***P<0.0005 (two-tailed unpaired t-test). C–E, CFSE-labeled purified CD8+ T cells from WT or Def6−/− (KO) mice were stimulated with plate-coated anti-CD3 (5µg/ml) plus soluble anti-CD28 (2.5µg/ml) mAbs for 72h in the presence or absence of exogenous IL-2 (100 U/ml). Cells were then stained with Annexin V and active caspase 3 Ab and analyzed by flow cytometry. C, CFSE dilution and active caspase-3 staining allow to concurrently assess cell division and cell death of CD8+ T cells. Numbers indicate the % of active caspase-3+ cells. D, the percentage of active caspase-3−CD8+ T cells with more than 2 divisions upon 72h of stimulation is shown. E, the percentage of active caspase-3+ Annexin V+ CD8+ T cells at the indicated times is determined. Data are representative of four (A–B) and three (C–E) independent experiments.

