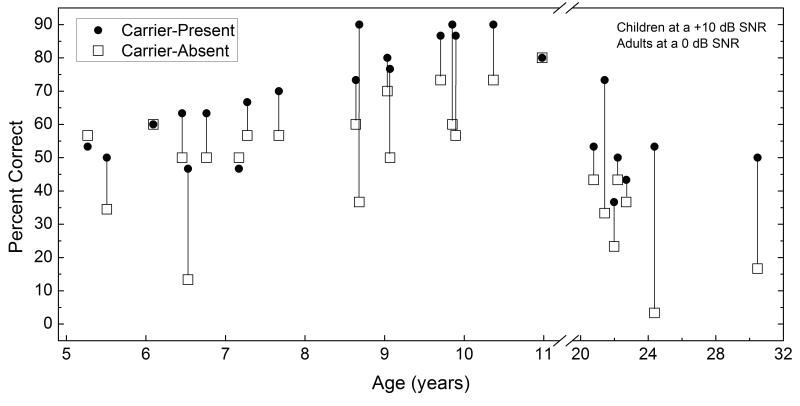
Figure 4.
Individual performance in the two-talker masker is shown as a function of listener age for listeners in the carrier-present (filled circle) and carrier-absent conditions (open square). The vertical line between each individual’s data points indicates the amount of carrier-phrase benefit. The absence of a vertical line indicates no benefit or a reduction in percent correct associated with inclusion of a carrier phrase. The adults shown on this figure are the group of adults tested at a 0 dB SNR, whereas children were tested at a +10 dB SNR.

