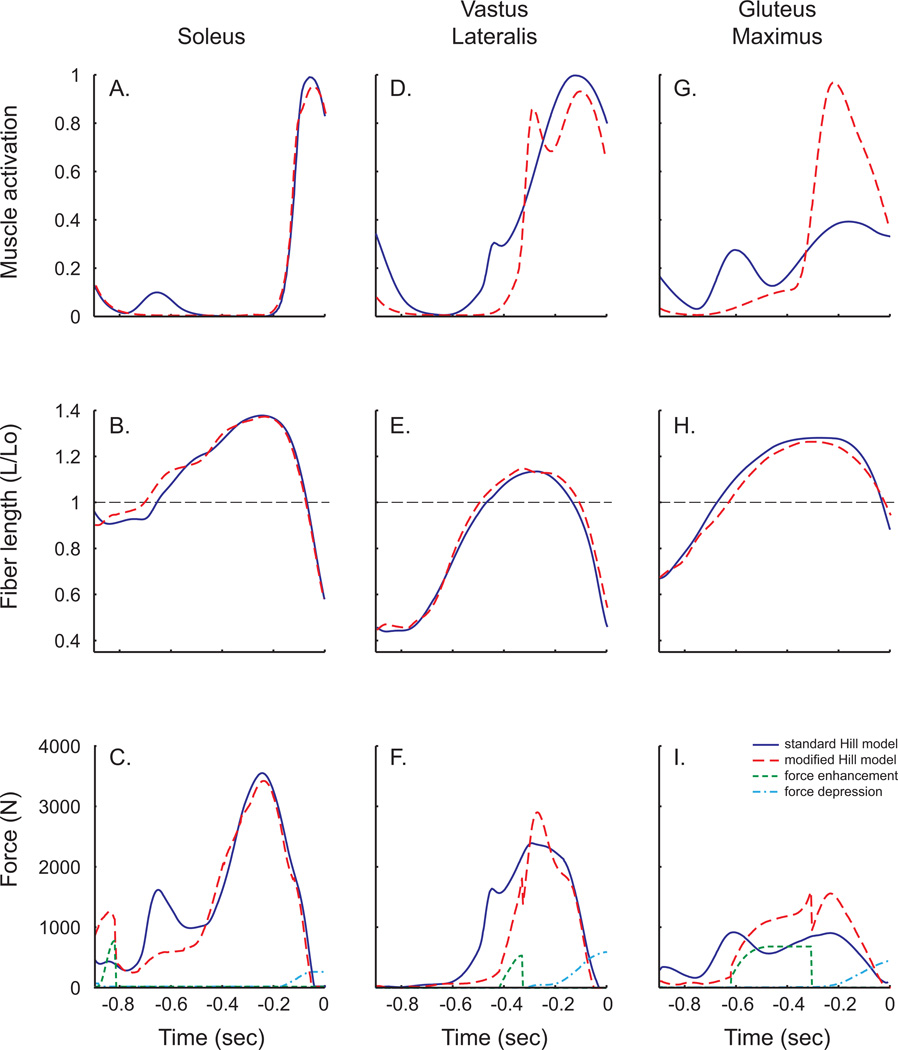
Figure 6.
Simulated muscle data for the soleus, vastus lateralis and gluteus maximus from the control simulation (solid lines) and simulation with the modified muscle model (dashed lines). Muscle activation patterns (top row) were allowed to vary between the two simulations. Slight differences in kinematics produced small differences in muscle length change (middle row). The magnitude of force generated by muscles with the modified muscle model included both stretch-induced force enhancement and shortening-induced force depression.

