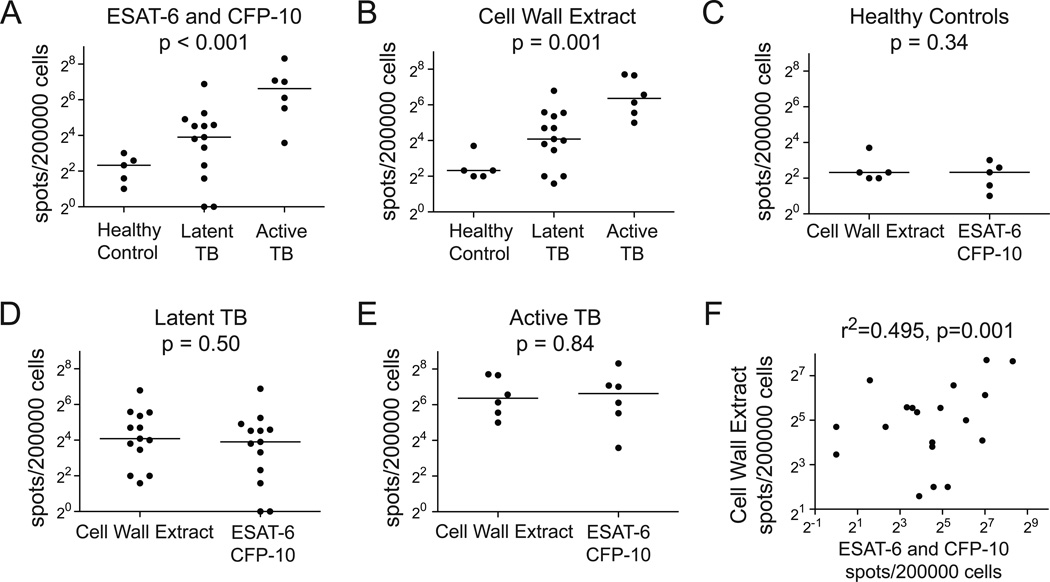
Figure 2.
Comparing the polyclonal lymphocyte response to cell wall antigens with model secreted antigens. DCs and PBMC were co-incubated overnight in the presence of 10 µg/ml M. tuberculosis cell wall extract or 10 µg/ml ESAT-6 and CFP-10. IFN-γ ELISPOT responses stratified by clinical group for (A) ESAT-6 and CFP-10 or (B) cell wall extract. Nonparametric trend test was used to compare responses among ordered groups. IFN-γ ELISPOT responses stratified by antigen for (C) Healthy Controls, (D) PPD Positive, or (E) Active TB study subjects. Wilcoxon rank sums test was used to test for statistical significance. (F) Linear regression comparing IFN-γ ELISPOT responses between cell wall extract and ESAT-6 and CFP-10 for subjects with latent or active tuberculosis.

