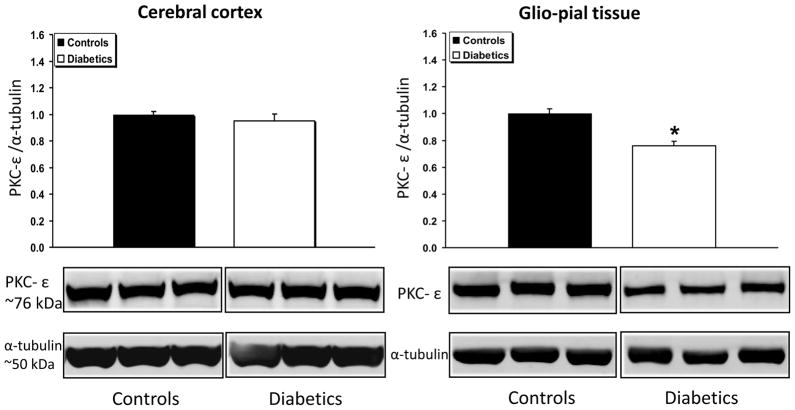
Fig 7.
PKC-ε expression profile in diabetic vs non diabetic rat brains in cerebral cortex and glio-pial tissue. Western immunoblot protein analysis of PKC-ε in samples obtained from the cerebral cortex (left) or by stripping off pial tissue from the surface of the brain (right) in control and 4 month diabetic rats. Representative blots and quantitative protein expression data for PKC-ε and α-tubulin in control and diabetic rats are shown (*, P < 0.05; n = 5 in each group). See Materials and Methods for technical details.

