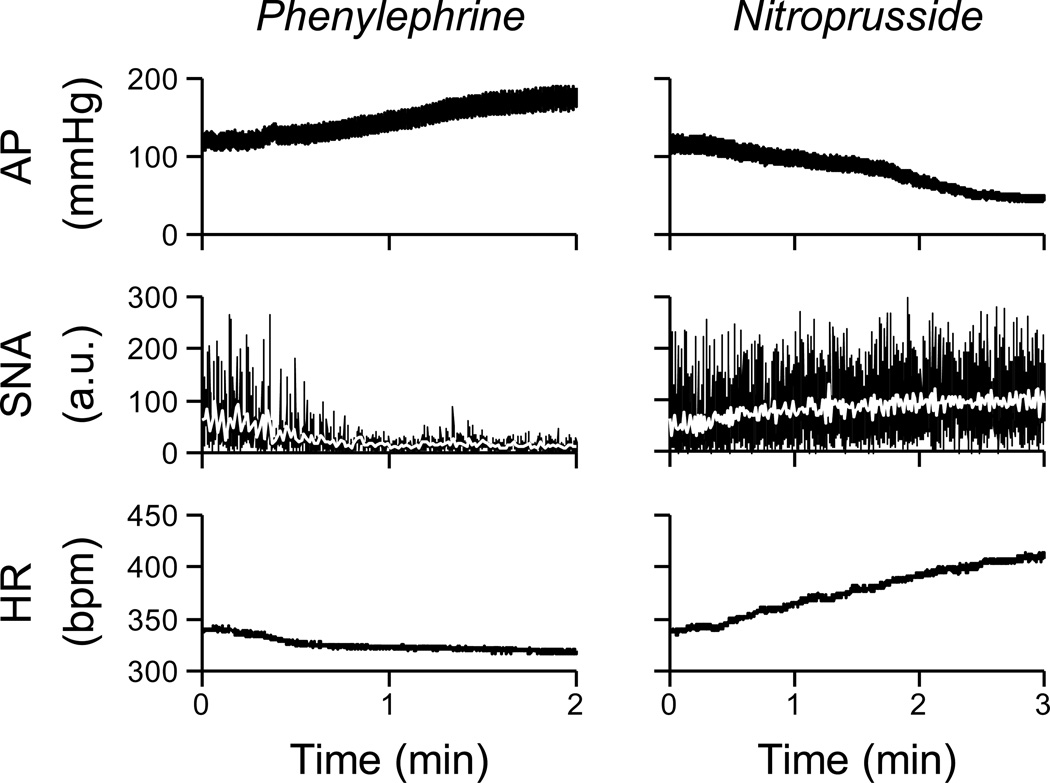
Figure 2.
Typical recordings of AP, renal sympathetic nerve activity [SNA; in arbitrary units (a.u.)], and HR obtained in anesthetized rat. The rate of infusion was adjusted to produce continuous changes in AP at 1 mmHg/s. Data in this figure were resampled at 10 Hz. White lines in the SNA panels were resampled at 1 Hz. Raw data was sampled at 1000 Hz.

