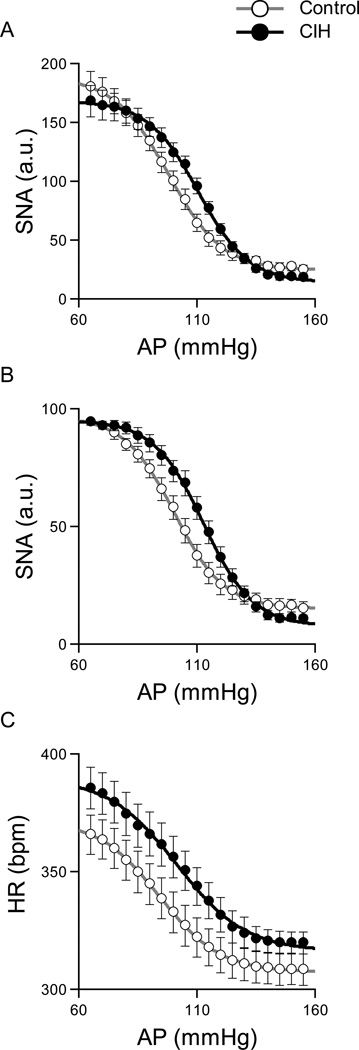
Figure 4.
Baroreflex control of SNA (A: baseline = 100 au, B: maximum = 100 au) and HR (C) averaged for the control (n = 18) and CIH (n = 16) rats in anesthetized rats. After exposure to CIH, the AP-SNA relationship shifted rightward (Table 1). Baroreflex parameters in the AP-HR relationship did not differ statistically between control and CIH rats.

