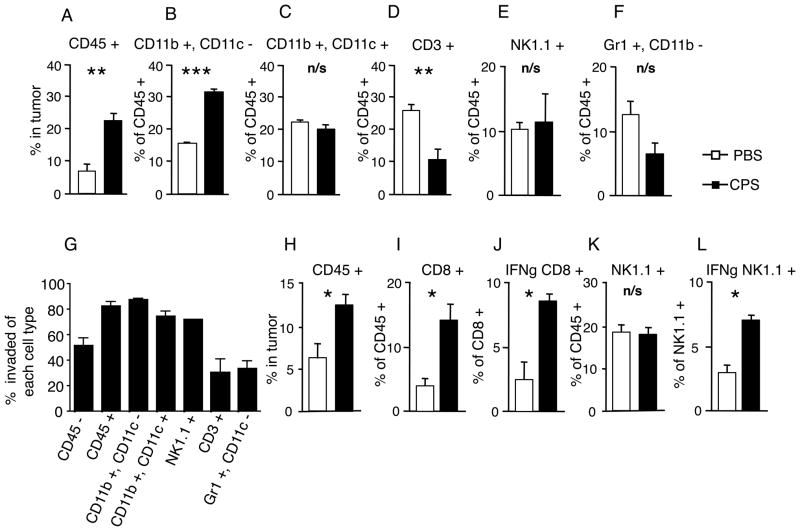
FIGURE 2.
cps treatment rapidly increased leukocyte infiltration of tumors and leukocytes were invaded by cps. (A–F) 4mm tumors were treated twice 24 hours apart and harvested 18hrs later to assess cell infiltration into tumor and assayed for: (A) percentage of CD45+ cells in the tumor, (B–F) the percentage of major leukocyte subsets within the CD45+ cells in the tumor, (B) CD11b+CD11c− cells, (C) CD11b+CD11c+ cells, (D) CD3+ cells, (E) NK1.1+ cells, (F) Gr1+CD11b−. White bars are control PBS-treated, black bars are cps-treated. (G) 1.5×10⁷ CFSE-stained tachyzoites of cps were injected twice 24 hours apart into 4mm tumors that were harvested 18hr later. Cells were assayed for % of each ell type invaded by cps in the tumor. (H–L) 4mm tumors were treated as previously on 2 consecutive days and then harvested 3 days later to assess cell infiltration into tumors. White bars are PBS-treated and black bars are cps-treated. (H) % CD45+ cells in tumor, (I) % of CD45+ cells that are CD8+ cells, (J) % of CD8+ cells that are expressing IFN-γ, (K) % of CD45+ cells that are NK1.1+, (L) % of NK1.1+ cells that are expressing IFN-γ. Error bars are SEM; P values: * < 0.05, ** <0.01, *** < 0.001. n= minimum of 4 mice per group, data are representative of 2 independent experiments.

