FIGURE 3.
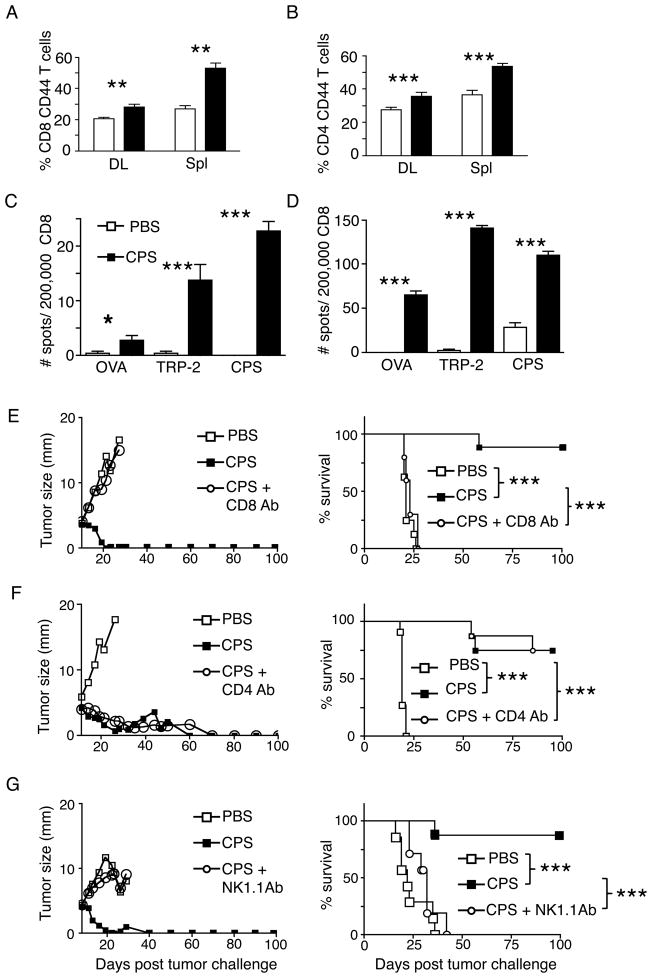
Treatment generates tumor antigen-specific responses and efficacy requires CD8+ T and NK cells. (A–C) Assays were done on day 20 post tumor challenge, 6–8 days past the final cps treatment. (A) % of CD8+ T cells that are antigen-experienced (CD44+) in draining lymph nodes (DL) and spleen (Spl). (B) % of CD4+ T cells that are antigen-experienced (CD44+) in draining lymph nodes (DL) and spleen (Spl). IFN-γ ELISPOT showing tumor antigen TRP-2 and T. gondii (cps) antigen-specific CD8+ T cells are enriched in draining lymph nodes (C) and spleen (D). OVA was an irrelevant peptide control. (E) B16F10 tumor bearing mice treated with cps or PBS, after CD8+ T cell depletion, left is average growth curves for the groups and right is survival curves. Similar for (F) CD4+ T cell depletion or (G) depletion of NK (NK1.1+) cells. Error bars are SEM; P values: * < 0.05, ** < 0.01, *** < 0.001. Growth curves show mean value with no error bars for visual clarity. n= minimum of 6 mice per group, data are representative of at least 2 independent experiments.

