
FIGURE 2. Representative spectratype histograms in the B10.BR anti-CBA and anti-MMC6 CD8+Vβ13+ T cell responses in lymphoid tissue.
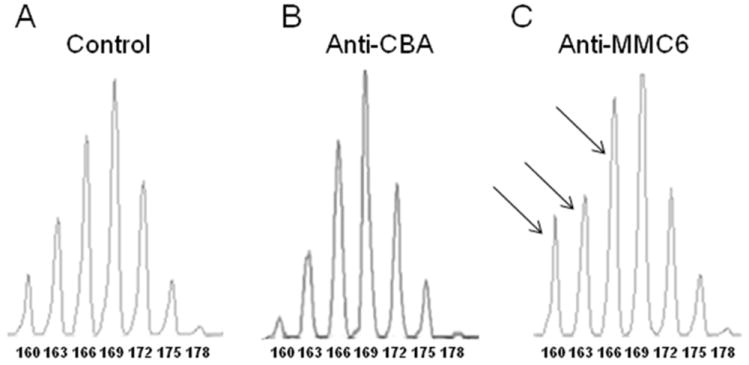
Spectratype analyses were performed on CD8+ T cell populations as described in Materials and Methods. (A) CD8+ splenic T cells harvested from naïve B10.BR mice acted as the control group. (B) For alloreactive responses (anti-CBA), CBA mice were exposed to lethal irradiation (11 Gy, split dose) and transplanted with 1-2×10⁷ B10.BR CD8+ T cells. Splenocytes were harvested at 10-13 d post-BMT. (C) For the anti-tumor response (anti-MMC6), B10.BR mice were presensitized (i.p.) with 1×10⁷ MMC6 tumor cells (40 Gy), followed by a second injection of 1×10⁶ MMC6 cells (40 Gy) in the footpad 17-21 d later. After 1 wk, draining lymph nodes were harvested and CD8+ T cell isolated. Skewing was defined as a peak area greater than the mean of the control plus 5×SD. CDR3 lengths are shown under each peak. Skewed peaks are marked with an arrow.