
Figure 4.
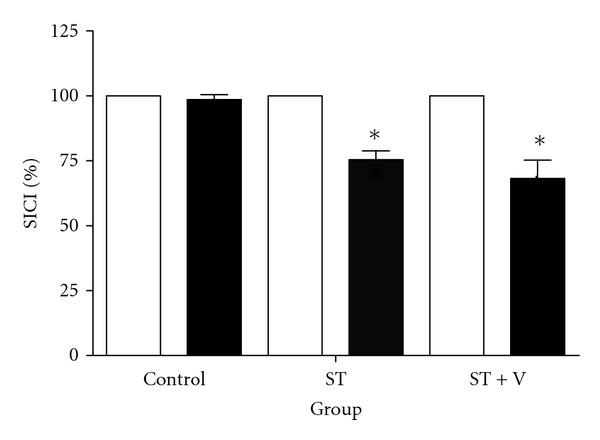
Mean ± SE SICI (expressed as a percentage change) for all groups before (light bars) and after training (dark bars). *denotes a significant reduction in SICI following training for the ST and ST + V groups (P < 0.016); however, no differences in SICI following training were observed between the ST and ST + V groups (P = 1.00).