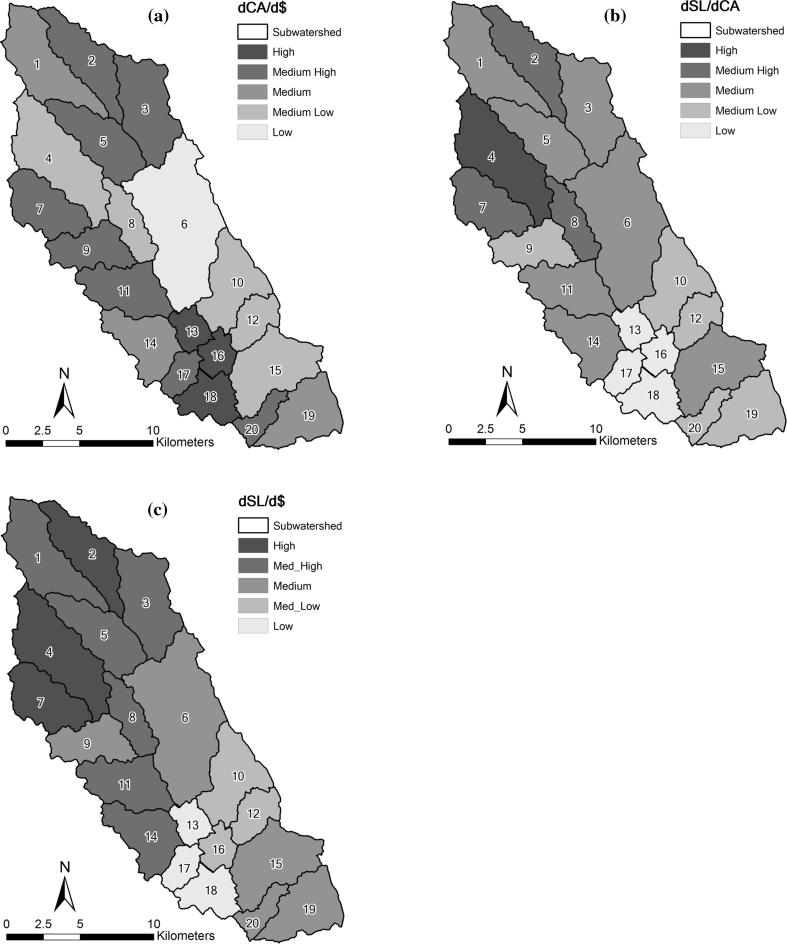
Fig. 6.
Comparison of mapped ranks for a the marginal change in conserved area per conservation dollar (dCA/d$), b the marginal change in sediment load per conserved area (dSL/dCA), and c the marginal change in total sediment load per conservation dollar (dSL/d$) in the LREW, which are based on uniform conservation cost indicator. The numbers on the map indicate subwatershed number, and rank is indicated by color. High ranks indicate high conservation priority (Color figure online)

