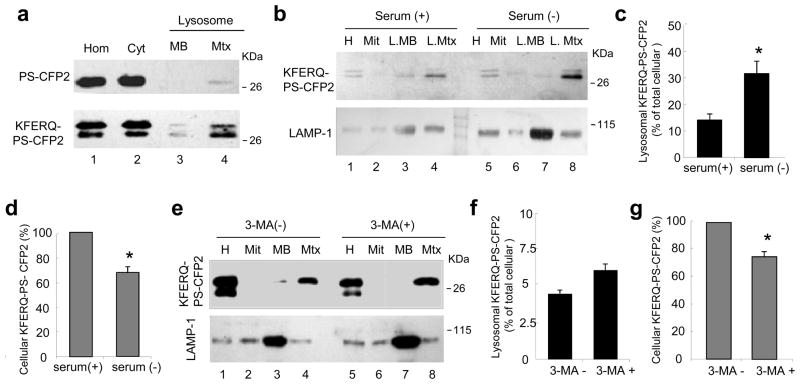
Figure 5. KFERQ-PS-CFP2 proteins reach the lysosomal lumen.
(a) Immunoblot with the antibody that recognizes PS-CFP2 of homogenates (Hom), cytosol (Cyt) and lysosomal membranes (MB) and matrices (Mtx) isolated from mouse fibroblasts stably expressing PS-CFP2 or KFERQ-PS-CFP2 proteins 16h after serum removal. (b) Immunoblot for the indicated proteins of homogenates (Hom), mitochondria (Mit) and lysosomal membranes and matrices isolated from cells stably expressing KFERQ-PS-CFP2 maintained for 16h in media supplemented (+) or not (−) with serum. (c) Quantification of the amount of KFERQ-PS-CFP2 associated to lysosomes (matrix and membrane) performed in blots as the one shown in b. Values are expressed as percentage of the total KFERQ-PS-CFP2 in the cell and are mean + SE of three different experiments. Difference in the lysosomal associated KFERQ-PS-CFP2 between serum+ and serum− condition (*) were significant for p=0.033 (t-test). (d) Changes in the intracellular content of KFERQ-PS-CFP2 upon serum removal. Values are expressed as percentage of KFERQ-PS-CFP2 present in serum-supplemented cells and area mean + SE of three different experiments. Values are mean+ SE of three different experiments and differences are significant (*) for p=0.007 (t-test). (e–g) Effect of inhibition of macroautophagy by treatment with 3-methyladenine (3-MA) on the lysosomal content of KFERQ-PS-CFP2 in cells maintained in serum-free media for 16h. (e) Immunoblot for the indicated proteins of the same fractions as described in b. The amount of KFERQ-PS-CFP2 associated to lysosomes (f) and the changes in the intracellular content of KFERQ-PS-CFP2 were calculated as in c and d. Values are mean+ SE of three different experiments and differences are significant (*) for p=0.032 (t-test).

