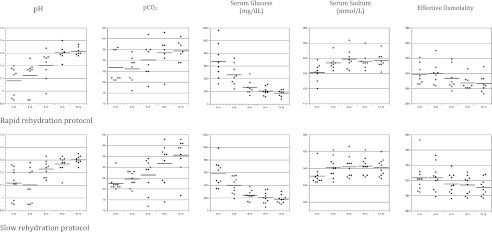
FIGURE 1.
Changes in biochemical values during DKA treatment with rapid fluid infusion versus slow fluid infusion. Slope (95% confidence interval [CI]) for group A, slope (95% CI) for group B, and P value for each variable: pH: 0.021 (0.015 to 0.028), 0.017 (0.012 to 0.023), P = .39. PCO2: 0.75 (0.28 to 1.21), 1.05 (0.64 to 1.47), P = .33. Glucose: –41 (–55 to –29), –33 (–45 to –21), P = .35. Sodium: 0.56 (0.31 to 0.81), 0.35 (0.13 to 0.57), P = .23. Effective osmolality: –1.2 (–1.8 to –0.7), –1.1 (–1.6 to –0.6), P = .80. Note: Average slopes are the maximum likelihood estimates of the treatment group specific fixed effect of time from mixed effects linear regression models for longitudinal data. Models were specified with fixed effects for time of treatment, group, and the interaction of group and time and random effects for slopes and intercepts.

