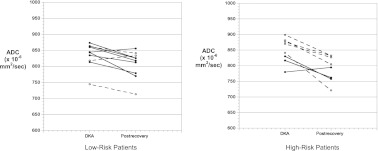
FIGURE 5.
Brain ADC values in patients at higher risk and lower risk of DKA-related CE. Solid circles: slow rehydration protocol; open circles: rapid rehydration protocol. P = .09 for comparison of ADC changes between groups in low-risk patients, P = .46 for comparison of ADC changes between groups in high-risk patients.

