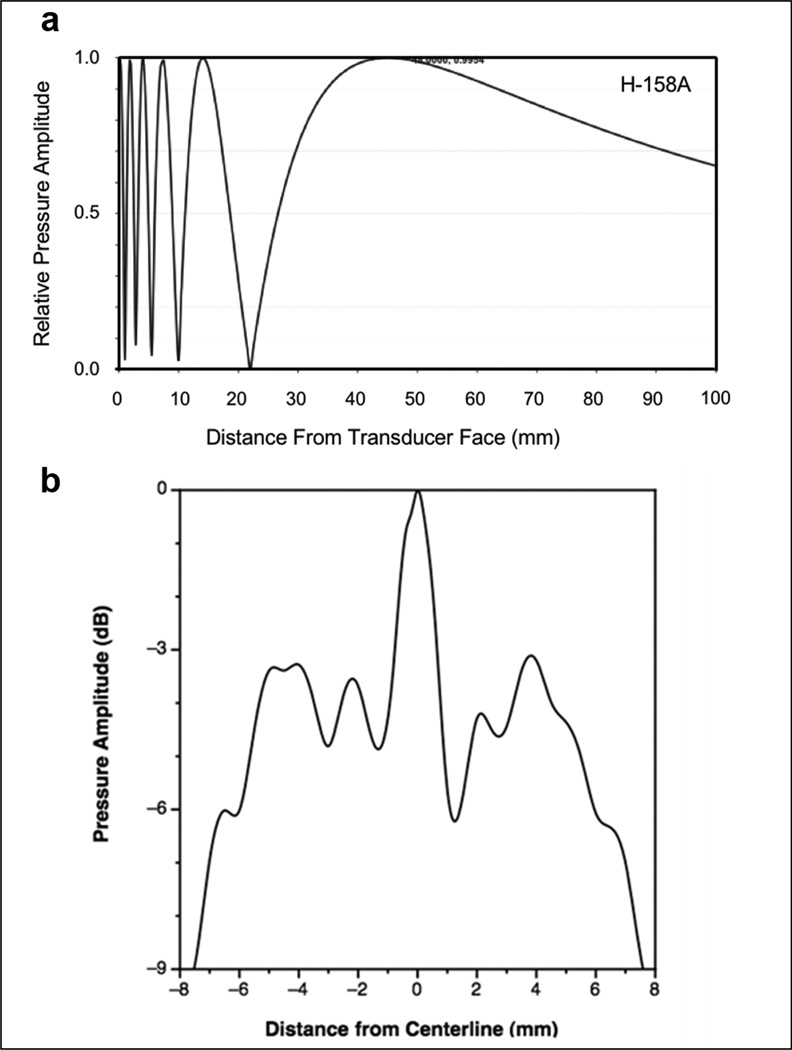
Figure 1. Acoustic pressure profiles of the H-158A unfocused H158A transducer in the near field.
(a) Axial acoustic pressure profile. For treatment of livers, the acoustic path through the organ is on the order of 3 – 5 mm; the axial profile shows that the pressure amplitude goes through about 3 maxima and minima in the first ~5 mm from the transducer face. (b) Transaxial pressure profiles. The near field profile was measured as close as practically possible to the transducer face, and represents a tomographic section located 6.2 mm from the emitting surface as assessed by time-of-flight of the sound waves. A high level of structure is seen, with annular rings of higher or lower pressure ‘populating’ a central pseudo-plateau about 10 mm wide if defined by the coordinates at which the sharp peripheral roll-off began, or 12 mm wide if defined by the full width, half maximum pressure beam diameter at this transaxial plane. A narrow peak of ~2 mm diameter (~0.03 cm2) is present at the center of this profile; this represents a very small fraction of the total radiating area. However, cavitation phenomena are influenced by peak pressure values, and the transducer was not stationary when applied to the rat livers, so some parts of the liver were exposed to peak pressures considerably larger than the spatial average value within the half maximum, full width beam diameter.

