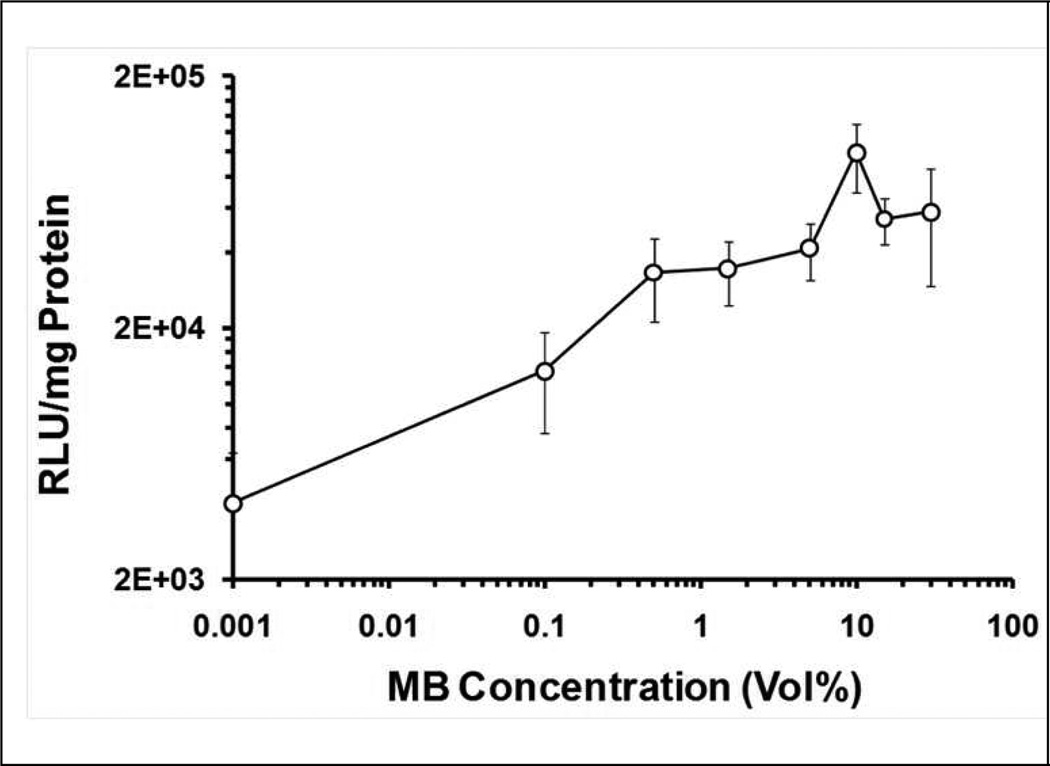
Figure 4. Dependence of transgene expression on Definity® concentrations mediated by US exposure with simultaneous injection of pDNA + MB mixture via portal vein branch.
Different concentrations of Definity® (Vol%: 0~30%) were employed for gene delivery under the US exposure conditions of 1.1 MHz frequency, 2.7 MPa peak negative pressure, 20 cycle pulses, 13.9 Hz PRF, and 90 s total US exposure, the first 45 s of which were coincident with injection of pDNA and Definity®. In order to present the Definity® concentrations on a log scale (to better resolve the data at low Definity® concentrations), the true 0 Vol% Definity® data are plotted at an arbitrarily small value (0.001 Vol%) concentration as a graphic expedience. Error bars indicate the standard error of the mean (n=6).

