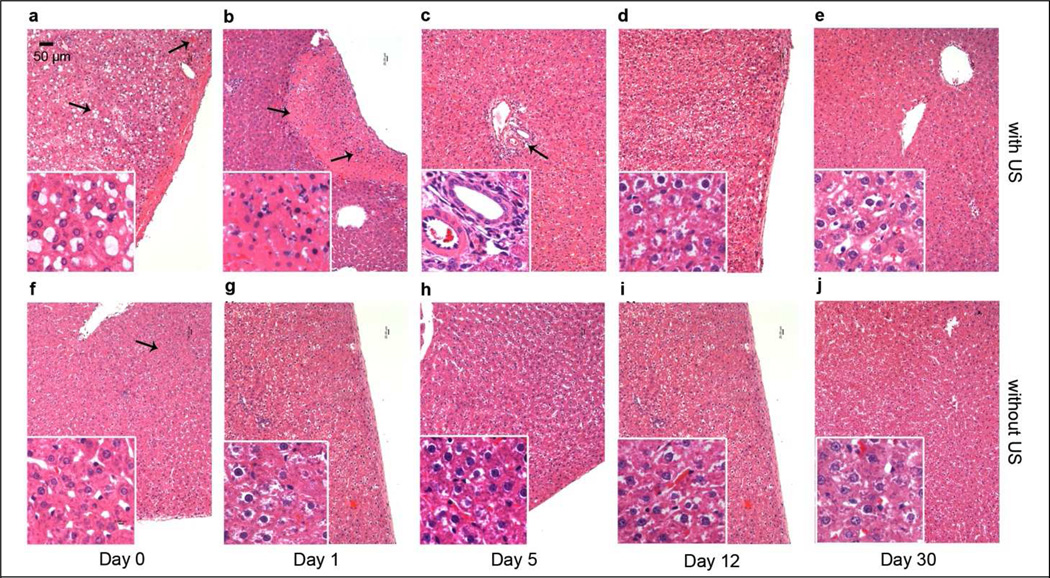
Figure 7.
Comparison of the histology features of rat livers injected with pDNA and MB via portal vein and simultaneously treated with (a–e) and without (f–j) 2.7 MPa US exposure. The livers were harvested on day 0, 1, 5, 12, 30 after treatment for H&E staining. Original magnification X100, X400 in inserts. Scale bar = 50 µm.

