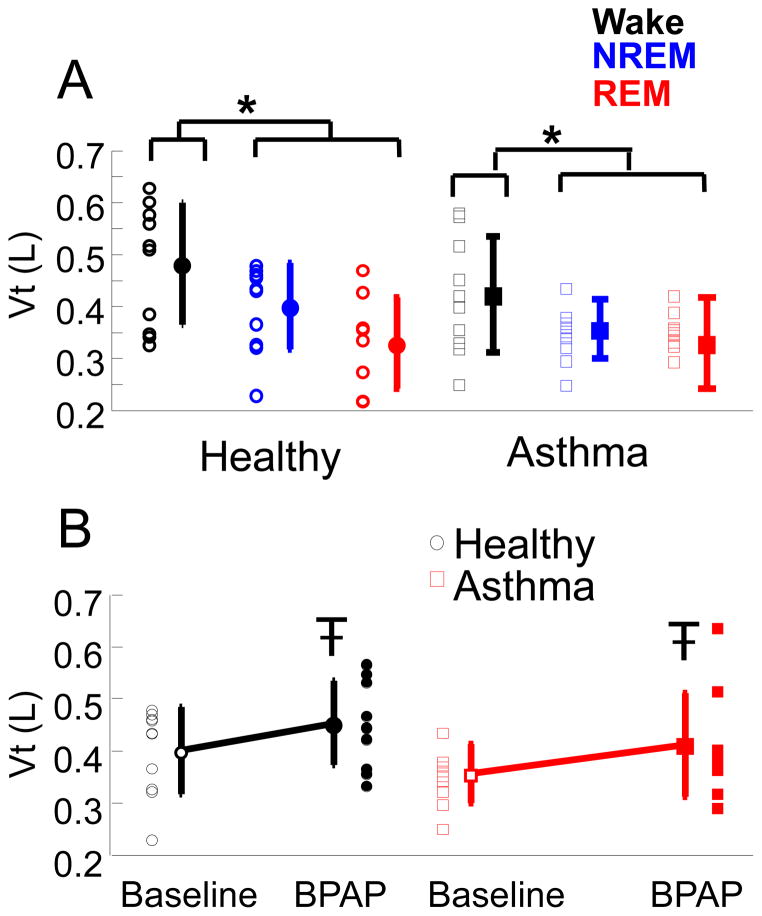
Figure 4.
A) Tidal volumes (Vt) for healthy (circles) and asthma (squares) subjects at baseline in wake (black), NREM (blue), and REM (red) sleep. Individual data and Mean ± SD are plotted. *p<0.001 ANOVA, tidal volumes during wake are larger than NREM and REM sleep, independent of disease.
B) Tidal volumes (Vt) for healthy (black circles) and asthma (red squares) during NREM sleep at baseline and on BPAP. Individual data and Mean ± SD are plotted. p<0.05 ANOVA, Vt on BPAP is larger than Baseline independent of disease.

