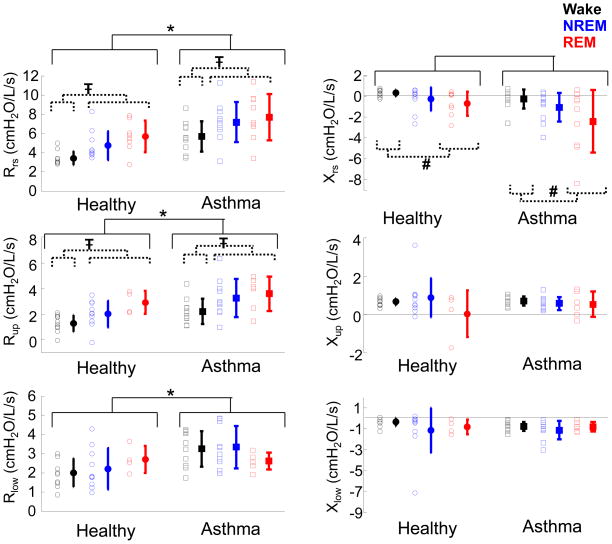
Figure 5.
Baseline resistance (left) and reactance (right) during wake (black), NREM sleep (blue), and REM sleep (red). Individual data and means ± SD are plotted; healthy (circles) and asthma (squares). *p<0.001, Rrs, Rup, Rlow larger in asthma than healthy. Ŧ p<0.01, Rrs and Rup larger in NREM and REM sleep as compared to wake. § p<0.02, Xrs more negative in asthma. # p<0.05 Xrs is more negative in REM sleep as compared to wake.

