
Figure 1. Change in Hormone Levels at Completion of Study Intervention and Late Follow Up.
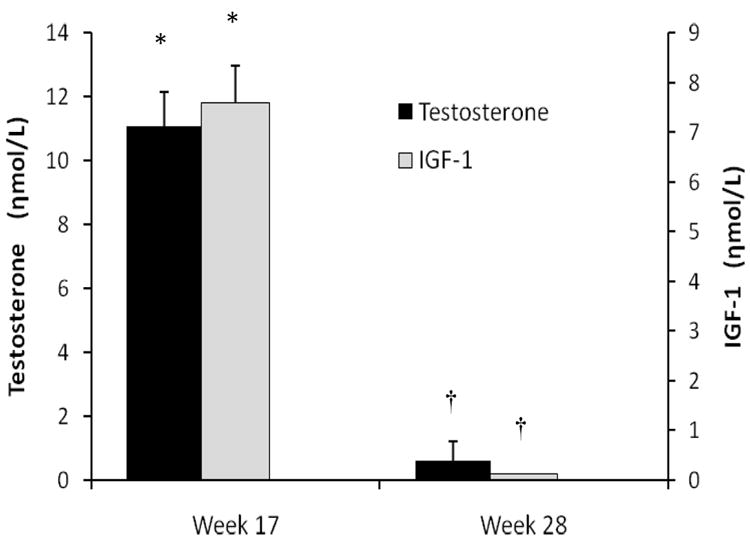
Changes in serum testosterone (black bars) and IGF-1 (gray bars) at week 16 compared to baseline and week 28 compared to baseline. Whiskers are standard error bars. * represents within group change of p<0.0001 compared to baseline and † represents differences (p<0.0001) between the two time points. At week 28, levels were not different from baseline (p>0.05). For conversion to non-SI units, divide testosterone by 0.0347 (ηg/dL) and IGF-1 by 0.131 (ηg/mL).