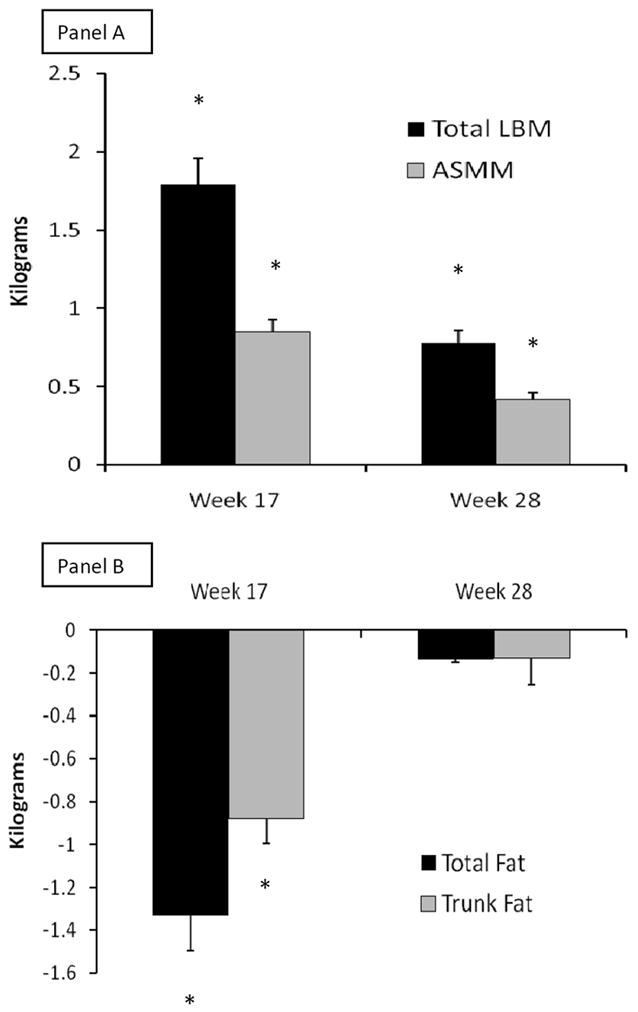
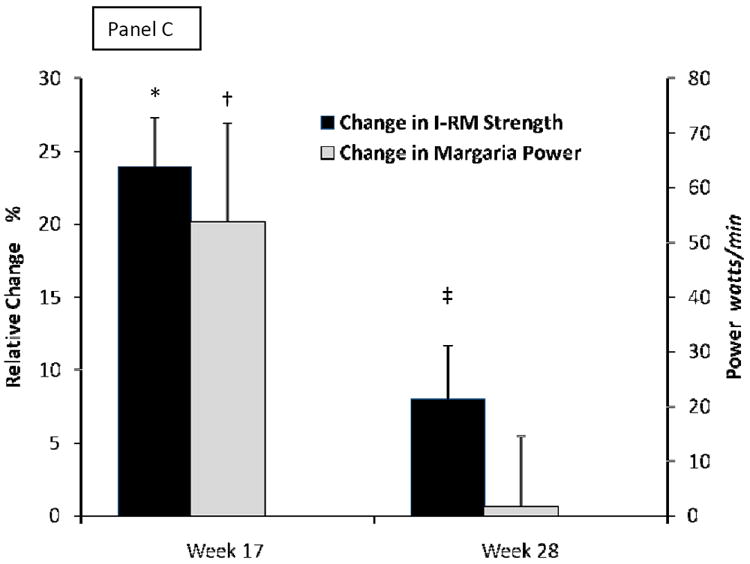
Figure 2. Changes in Body Composition and Muscle Performance at Study Intervention Completion and Late Follow Up.


Changes from baseline to week 17 or week 28 for total lean body mass (LBM, black bars) and appendicular skeletal muscle mass (ASMM, gray bars) in panel A, for total fat mass (black bars) and trunck fat (gray bars) in panel B, and for maxium voluntary strength as composite of 1-repetition maximum (1-RM, black bars) and Margaria stair climbing power (gray bars) in panel C. Whiskers are standard errors bars. * is p<0.0001, † is p=0.002, and ‡ is p=0.03 for time points versus baseline. For conversion to non-SI units, divide testosterone by 0.0347 (ηg/dL) and IGF-1 by 0.131 (ηg/mL).
