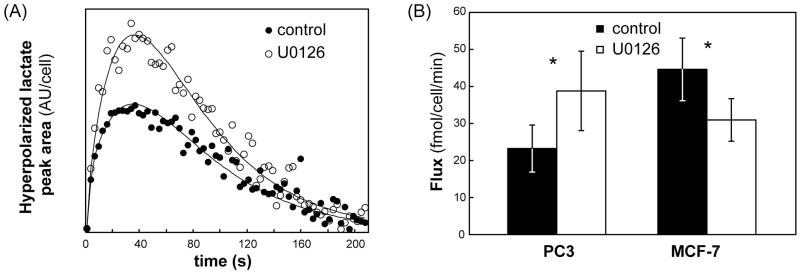
Figure 2.
Effects of treatment with U0126 on PC3 and MCF-7 cell metabolism. (A) Experimental build-up curves (symbols) for hyperpolarized lactate and their fit to the Bloch equation (solid line) for untreated and U0126-treated PC3 cells; (B) Flux of 13C hyperpolarized label in untreated (black) and U0126-treated (white) PC3 and MCF-7 cells. Data is shown as mean ± standard deviation. *: p<0.025.

