
Figure 4.
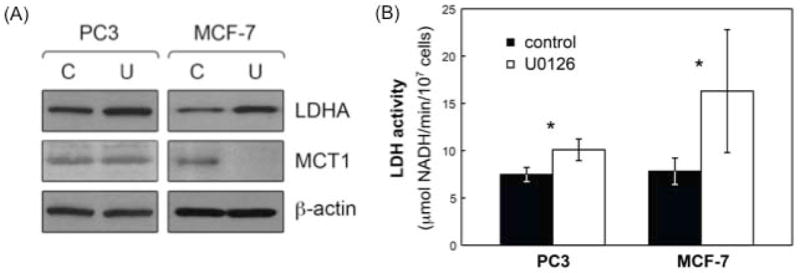
Effects of treatment with U0126 on LDHA expression and activity and MCT1 levels in PC3 and MCF-7 cells. (A) LDHA and MCT1 levels in untreated (solvent control; C) and U0126-treated (U) PC3 and MCF-7 cells probed using Western blotting. β-actin was used as a loading control; (B) LDH activity modulation in untreated (black) and U0126-treated (white) PC3 and MCF-7 cells. Data is shown as mean ± standard deviation. *: p<0.037.