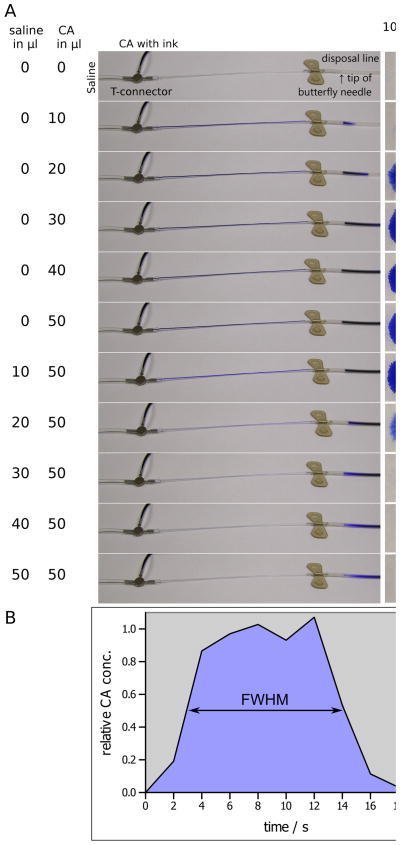
Figure 1.
A: Optical assessment of a contrast agent (CA) bolus injection in increments of 10 μL. The 2 left columns denote the cumulative amount of injected saline and ink-colored CA solution. The center column shows the flow of the contrast agent from the T-connector to the tip of the butterfly needle into a disposal line. The column right of the center column shows blots of 10 μL drops in which color intensities were used to estimate relative CA concentrations of the bolus (far right column) with respect to the average concentration of the 4 highest CA concentrations. B: Graphical representation of the CA-bolus. The full width at half-maximum (FWHM) represents the bolus length, which was approximately 10 s.

