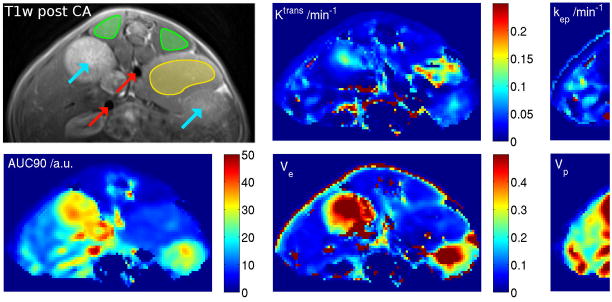
Figure 3.

Anatomic slice and corresponding maps of pharmacological parameters (AUC90, Ktrans, kep, ve and vp). Pixels for arterial input function (AIF) estimation and regions of interest (ROIs) for DCE-MRI evaluation were selected on the AUC90 map. Anatomic confirmation ensured that only large vessels were used for AIF derivation (red arrows) and for DCE-MRI evaluation muscle (green ROIs) and tumor (yellow ROIs) was used. Turquoise arrows denote the kidneys.
