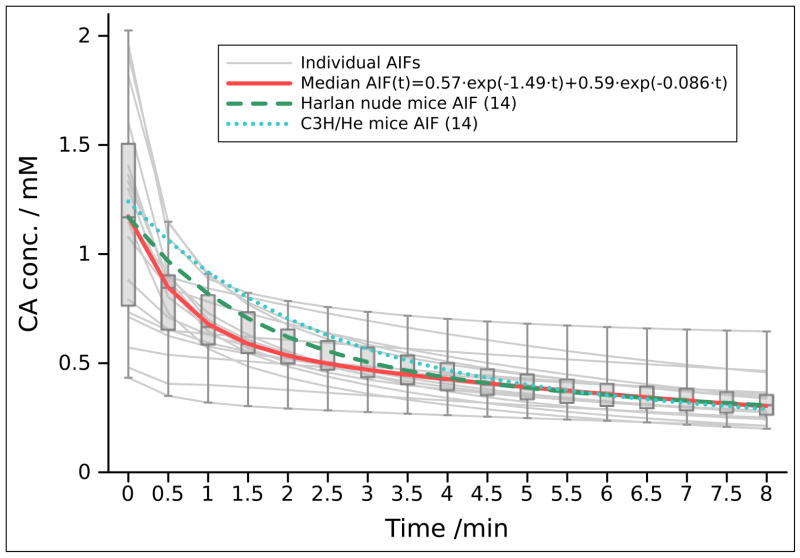
Figure 4.
Individual and median AIF values for the 19 successful experiments for the first 8 min after CA injection. There was a high variation in individual AIF values, especially for the initial values with the median CA concentration of 1.17 mM. A bi-exponetial fitting curve was used for a better comparison with previously reported values of average AIF obtained from Harlan nude mice and C3H/He mice with similar injection parameters (14).

