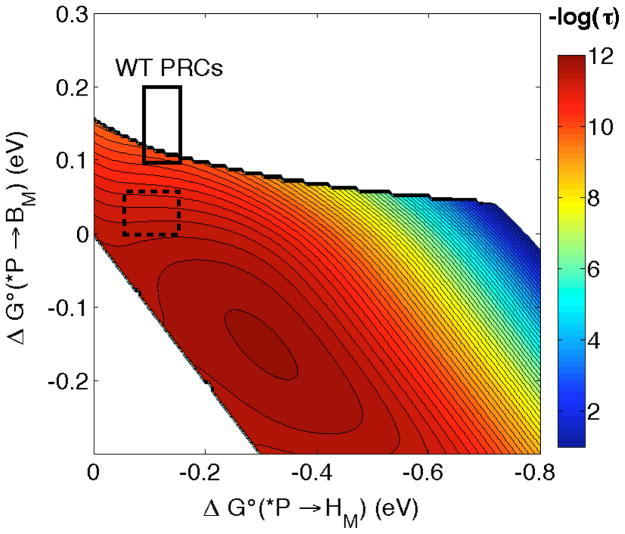
Figure 4.
Hopping map for *P → BM → HM in PRCs at 298 K with λ*P/BM = λBM/HM = λ*P/HM = 0.15 eV and β = 1.1 Å−1. Distances (Å) are r1 = 5.0, r2 = 5.3, rT = 10 Å. The solid black box is the estimated range of driving forces in WT PRCs and the dotted box is the estimated driving force range in modified DLL PRCs [18]. The contour lines are plotted at 0.2 log unit intervals.

