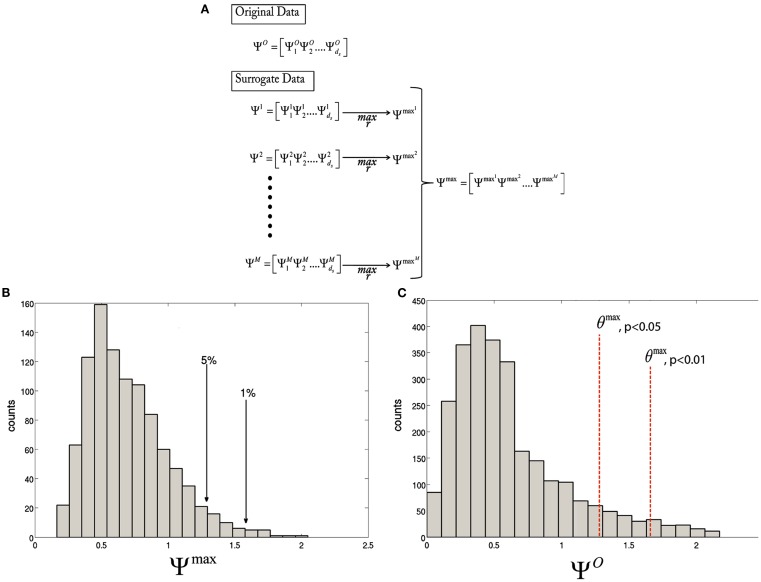
Figure 1.
Diagram illustrating the statistical thresholding procedure. (A) The test statistic is calculated for every voxel for the original data,. Then, for each resampling of the data, is computed. Finally, the maximum over r is taken to obtain . (B) A histogram of the maximal distribution, , with arrows pointing to the 1st and 5th percentiles, corresponding to p < 0.01 and 0.05, respectively. (C) A histogram of the original statistic, , with the θmax, p < 0.01 and θmax, p < 0.05, corresponding to the values obtained in (B).

