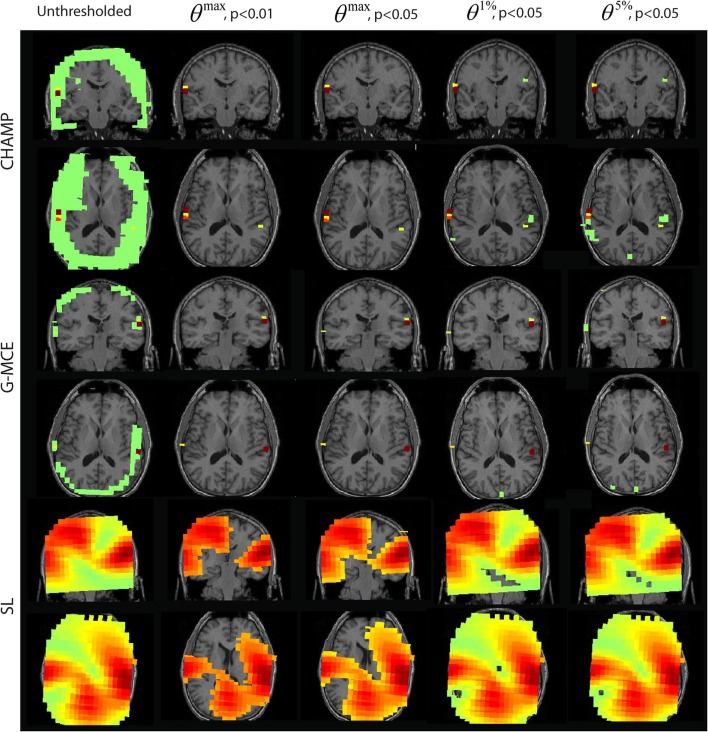
Figure 5.
Auditory evoked field (AEF) data: the source localization was performed on the first 30 trials of AEF data. The unthresholded post-stimulus power values in the window from 90 to 120 ms are shown in the first column (coronal slice). The power is thresholded with the maximal statistic: θmax, p < 0.01 and 0.05 and with the alternative to the maximal statistic thresholds: θ1%, p < 0.05, and θ5%, p < 0.05.

