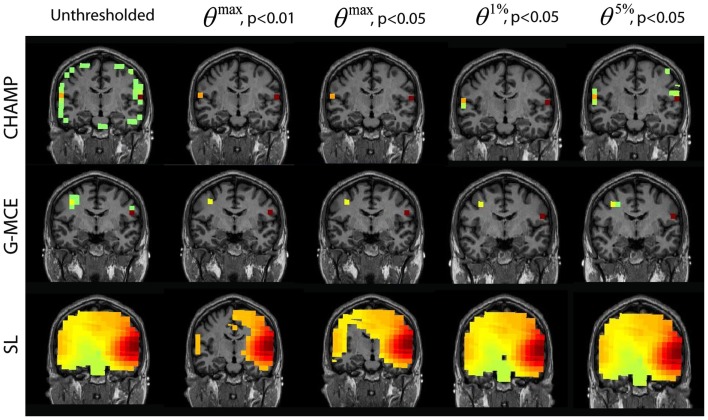
Figure 6.
AV data: the unthresholded post-stimulus power values in the window from 80 to 140 ms are shown in the first column (coronal slice), from source location on the first 30 trails of data. The power is thresholded with the maximal statistic: 0max, p < 0.01 and 0.05 and with the alternative to the maximal statistic thresholds: θ1%, p < 0.05, and θ5%, p < 0.05.

