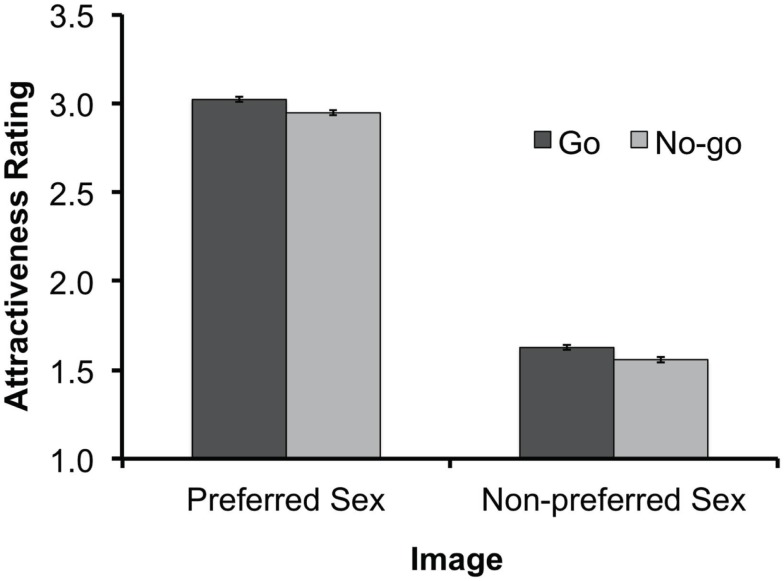
Figure 2.
Results of Experiment 1: mean hedonic-evaluation scores for each response type (“Go” vs. “No-go”) and for images of the preferred and non-preferred-sex. Evaluation scores ranged from 1 to 4, with larger values representing more positive hedonic ratings. Error bars represent standard errors of the means based on Loftus and Masson’s (1994) method for within-subjects designs.

