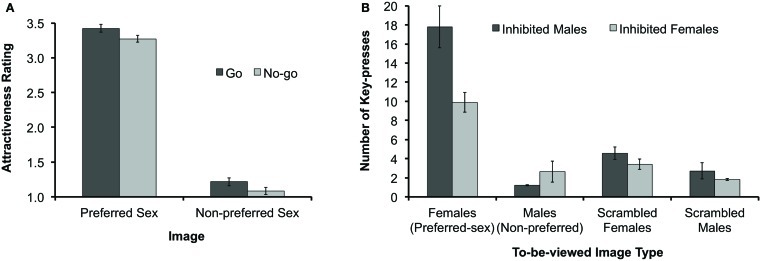
Figure 3.
Results of Experiment 2. (A) Mean hedonic-evaluation scores for each response type (“Go” vs. “No-go”) and for Preferred-sex and Non-preferred images. Evaluation scores ranged from 1 to 4, with larger values representing more positive hedonic ratings. (B) Number of key-presses to see attractive female images, attractive male images, and scrambled versions of these images, for participants who had previously inhibited either attractive female or attractive male images. Error bars represent standard errors of the means.

