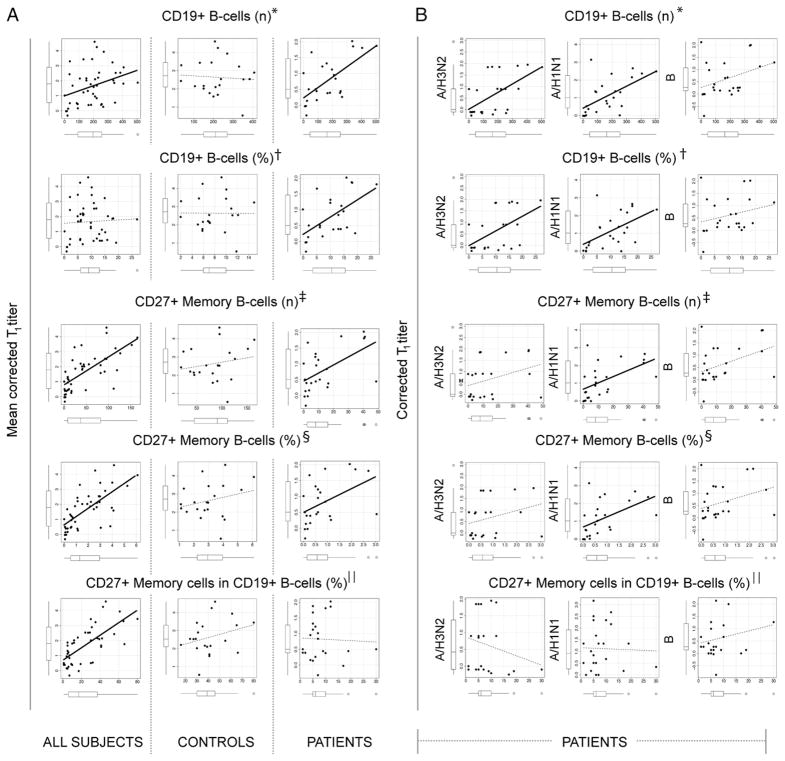
FIGURE 5.
Total B cells and CD27+ memory B cells correlate with corrected T1 titers for influenza vaccination in patients but not in healthy controls. A, Scatter plots representing the correlations of number and percentage of total and CD27+ memory B cells with mean corrected T1 titers in all subjects (left panels), controls (center panels), and patients (right panels). Box-and-whisker plots on each axis show median, IQR, and 95% confidence interval for the represented variable. Lines in the plots represent the linear regression for any given pair of variables. Thick continuous lines represent significant correlations. *Number of B cells/μl; †percentage of B cells in PBMCs; ‡number of CD27+ memory B cells/μl; §percentage of CD27+ memory B cells in PBMCs; ||percentage of CD27+ memory B cells in B cells. B, Scatter plots representing the correlations between the number and percentage of total and CD27+ B cells with corrected T1 titers for each influenza strain in patients. Correlations with the H3N2 strain are in the left panels, correlations with H1N1 are in the center panels, and correlations with B are in the right panels. Graph characteristics are the same as in A.

