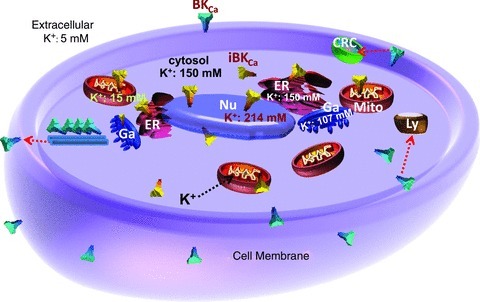
Figure 3. Intracellular organelles and potassium flow.

A schematic diagram depicting the major intracellular organelles with their inner K+ concentrations [K+]. [K+] inside the mitochondrion (Mito) is ∼15 mm (Zoeteweij et al. 1994), in the nucleus (Nu) is estimated as ∼214 mm (Nagy et al. 1981), and in the Golgi apparatus (Ga) is estimated as ∼107 mm (Schapiro & Grinstein, 2000). [K+] in the ER is assumed to be similar to that in the cytoplasm, in analogy to the concentrations found in toadfish (Somlyo et al. 1977). Extracellular K+ is 5 mm and cytosolic K+ is 150 mm. BKCa channels are also shown at the plasma membrane and associated with microtubules. Red arrows show translocation to clathrin reach compartments (CRC), lysosomes (Ly), and plasma membrane. Black arrow indicates the direction of K+ ion flux upon channel opening as predicted by calculating the Gibbs free energy, ΔG, for mitochondria: ΔG=ΔGK+ΔGV, where ΔGK is the free energy dependent on free K+ ions and ΔGV is the free energy dependent on the mitochondrial potential, according to: ΔGK=–RT ln([K+cytosol]/[K+matrix]) =−5609 J mol−1 where, R is the gas constant = 8.314 J (°K mol)−1, and T is the absolute temperature = 293°K at 20°C, [K+cytosol]= 150 mm, [K+matrix]= 15 mm and, ΔGV=FΔΨm=–17367 J mol−1 where, F is the Faraday constant = 96485 J (mol V)−1 and ΔΨm is the mitochondrial membrane potential, which is typically −180 mV (Kamo et al. 1979). Thus, ΔG=ΔGK+ΔGV=−22976 J mol−1 and K+ influx to the mitochondrial matrix is thermodynamically favoured. These equations can also be used to calculate ionic movements in other organelles.
