
Figure 5. Model ‘FSI–τSE–Neural’, a new mathematical model with non-renocentric pathway of hypertension.
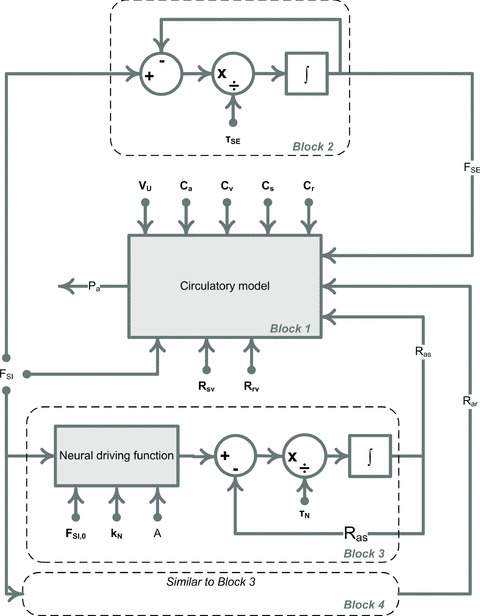
The block diagram representation of the mathematical model ‘FSI–τSE–Neural’ given by equations (1), (4) and (6). The circulatory subsystem (Block 1, see Fig. 2 and Fig. 3 for details) is paired with the two regulation mechanisms: sodium excretion is controlled by the sodium intake (Block 2) and arterial resistances are controlled via the long-term neural drive (Block 3 and Block 4). Block 4 is similar to Block 3 and thus is not shown in detail. The neural driving function is the right hand side of eqn (4), where j = ‘s’ and ‘r’ for Block 3 and 4, respectively. Parameters are shown in bold.