
Figure 7. Sodium excretion rate response to a step increase in sodium intake rate.
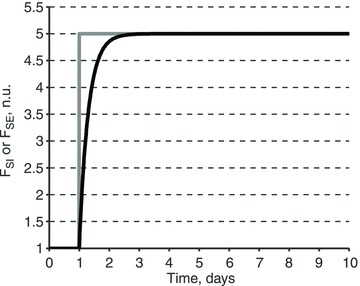
Sodium excretion rate (FSE, black) response to a 5-fold step increase in sodium intake rate (FSI, grey). The response is modelled as a first-order response with the time constant τSE = 0.3 days (see eqn (6)). Sodium rates are shown as a fraction of the normal sodium intake rate, FSI,0.