
Figure 3. Iodide treatment increases NIS protein turnover through the lysosomal pathway.
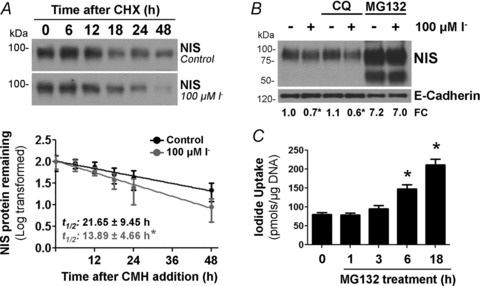
A, IEC-6 cells were cultured in the presence of 100 μm I− for 24 h; thereafter, 3 μm cycloheximide (CHX) was added to the culture media, and total cell lysates were obtained at the indicated times. Top panel, representative Western blot analysis showing NIS expression after blocking protein synthesis. Bottom panel, values from the densitometric analysis were used to calculate the NIS protein half-life (t1/2). Results are expressed as the logarithm of the percentage of remaining NIS expression vs. time; NIS expression before CHX addition (t= 0) was taken as 100%. Ponceau S staining was used to correct loading differences (not shown). Each value represents the mean ± SEM of three independent experiments. *P < 0.05 vs. control t1/2 (Student's unpaired t test). B, representative Western blot of cell extracts. IEC-6 cells were treated with 5 μm MG132 (proteasome inhibitor) or 50 μm chloroquine (CQ; lysosomal inhibitor) in the presence of 100 μm I− for 24 h. Inhibitors were added to cell cultures 30 min before I−. C, steady-state I− uptake in IEC-6 cells treated with 5 μm MG132 for the indicated periods of time. Iodide uptake is expressed as picomoles of I− per microgram of DNA. Each value represents the mean ± SD of two independent experiments done in triplicate. *P < 0.05 vs. untreated cells (time 0 h; ANOVA and Newman–Keuls test).