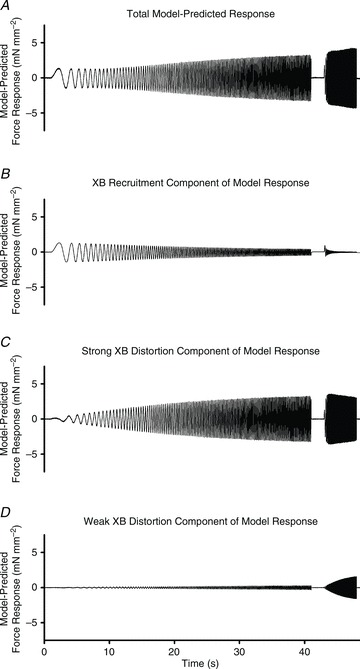
Figure 2. Representative chirp response model prediction.

Representative model-predicted force response (A) to chirp-perturbation of the same responses from the WT fibre data shown in Fig. 1. Model components are shown to illustrate: the slow phase, XB-recruitment component of the force response (B); the fast phase, strong XB-distortion component of the response (C); and the fastest phase, weak XB-distortion component of the response (D). The shape and magnitude of the response shown in panel A represents the summation of each of the model components. The shape and magnitude of the components shown in panels B, C and D are dependent on the values of their respective parameters.
