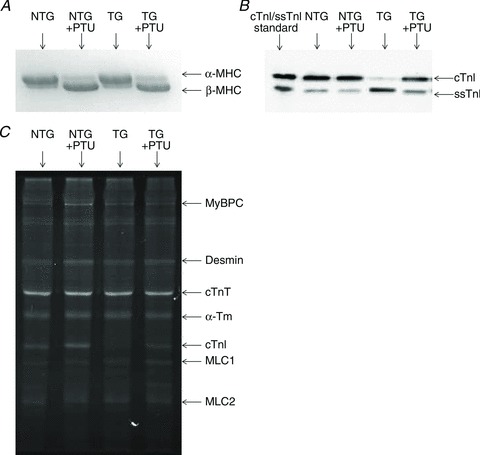
Figure 3. Assessment of sarcomeric protein content and phosphorylation status.

SDS-PAGE to determine the expression profiles of MHC isoform (A) and Western blot analysis to determine level of TnI isoform expression (B) of hearts from normal (α-MHC) or PTU-treated (β-MHC) cTnI NTG or ssTnI TG mice. Pro-Q Diamond staining (C) was done to determine the effects of PTU treatment or TG ssTnI expression on phosphorylation of sarcomeric proteins. Images are representative data from samples collected from at least 3 hearts in each group.
