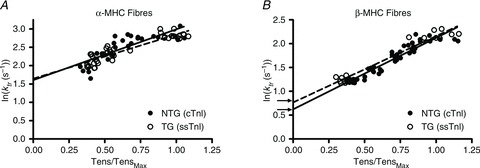
Figure 6. Rate constant of tension redevelopment, ktr, plotted as a function of level of activation (tension as normalized to maximal fibre tension, Tens/TensMax).

Because ktr exhibits an exponential trend with an increase in the level of activation, the logarithm of ktr vs. activation was plotted to linearize the trend. Regression analysis determined the intercept of the relationship of ktr vs. activation, which approximates the apparent rate of XB detachment, gapp (Baker et al. 1998; Palmer & Kentish, 1998; Fitzsimons et al. 2001; Tesi et al. 2002; de Tombe & Stienen, 2007). As show in panel A, the predicted intercept between α-MHC(cTnI) (continuous line) and α-MHC(ssTnI) (dashed line) fibres was not different. As show in panel B, the predicted intercept was slightly lower in β-MHC(cTnI) fibres (continuous line) when compared to β-MHC(ssTnI) fibres (dashed line) was slightly different. This difference in the intercept was significant, suggesting that gapp was slightly faster in β-MHC(ssTnI) vs. β-MHC(cTnI) fibres (Table 1).
