
Figure 7. pCa-tension relationships in fibres from α-MHC (A) or β-MHC (B) mice from cTnI NTG groups (•, continuous lines are Hill model fits) and ssTnI TG groups (○, dashed lines are Hill model fits).
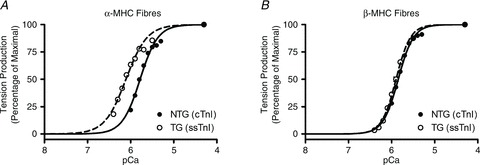
Data were normalized to maximal tension produced (pCa 4.3) by each respective fibre. Normalized curves were fitted to Hill's equation to determine the pCa50 and Hill's cooperativity coefficient, nH, for each group of fibres. As shown in Table 2, pCa50 was 5.78 ± 0.01 and 6.11 ± 0.01 for α-MHC(cTnI) and α-MHC(ssTnI) fibres, respectively, and 5.85 ± 0.01 and 5.90 ± 0.01 for β-MHC(cTnI) and β-MHC(ssTnI) fibres, respectively. nH was 2.16 ± 0.09 and 1.80 ± 0.04 for α-MHC(cTnI) and α-MHC(ssTnI) fibres, respectively, and 2.46 ± 0.06 and 2.62 ± 0.05 for β-MHC(cTnI) and β-MHC(ssTnI) fibres, respectively. Each point represents the average normalized tension produced from all fibres in each group ± SEM. Number of determinants was at least 10 for each group.