
Figure 4. Percentage changes in LV pressure–diameter area (PDA), an index of stroke work, and in  for a normalized comparison of these two parameters.
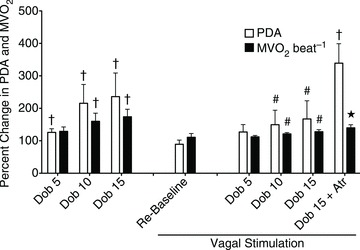
All measurements were taken with HR fixed at 165 beats min−1 (Pace). Data are presented as mean ± SEM, n= 7 for PDA and n= 8 for  . *P < 0.05 vs. pre-VS Baseline Pace; #P < 0.05 vs. corresponding time point pre-VS; **P < 0.05 vs. post-VS Baseline Pace; †P < 0.05 PDA vs.
 .
.