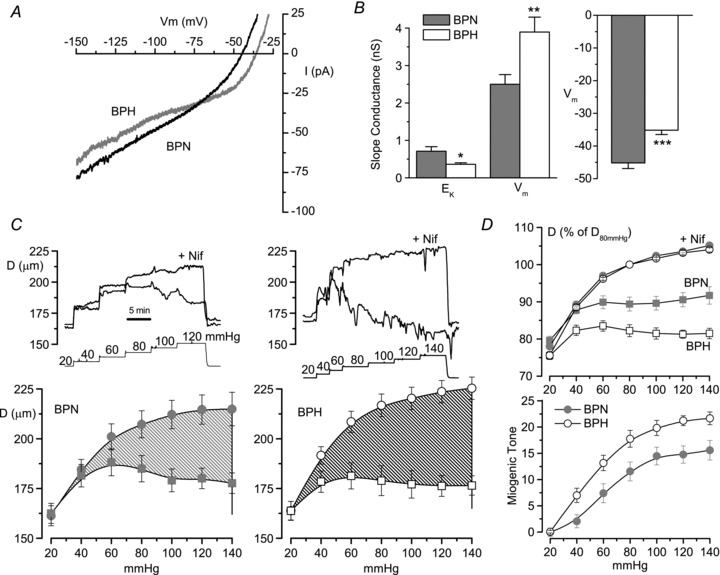
Figure 1. Differences in excitability between BPN and BPH mesenteric arteries.

A, currents obtained in depolarizing ramps from −150 to +30 mV in acutely dissociated VSMCs from BPN and BPH mesenteric arteries. Currents were recorded with the perforated patch configuration of the patch-clamp technique while cells were bathed in standard saline solution. Each trace is the average current from 9–11 cells. B, slope conductance was calculated from the linear fit of the current traces obtained from each individual cell around (±5 mV) EK (−80 mV in our experimental conditions) and VM (V at I= 0). Each bar shows the mean ± SEM of 13–16 determinations in each group. *P < 0.05, **P < 0.01, ***P < 0.001, Student's t test for unpaired data. Resting VM was obtained with direct measurements from current-clamp experiments. Data are from 37 BPN and 34 BPH cells. C, pressure–diameter curves obtained from mesenteric BPN and BPH arteries mounted on a pressure myograph, and subjected to step pressure changes (in mmHg) with the protocol shown in the insets. For each artery, pressure protocol was applied in control conditions (active diameter, Dcontrol, squares) and in the presence of nifedipine (passive diameter, Dnif, circles). The average diameters obtained at the different pressures studied from 11 arteries in each group are shown in the lower panels. The shaded areas represent the difference between passive and active diameter, i.e. the myogenic tone. D, the upper panel shows passive diameter (nifedipine, circles) and active diameter (squares) after normalizing each artery to the passive diameter obtained at 80 mmHg. The average myogenic tone obtained from BPN and BPH arteries and measured as 100 × (Dnif–Dcontrol)/Dnif is represented in the lower panel. n= 11 and 12 for the BPN and BPH groups, respectively.
