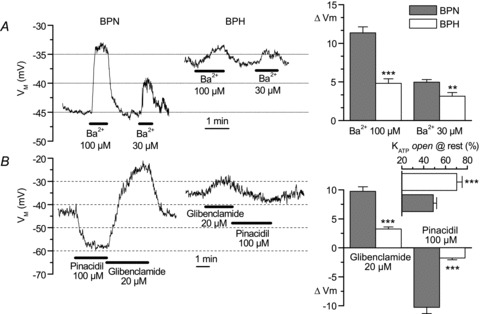
Figure 5. Contribution of KIR and KATP channels to resting VM in BPN and BPH mesenteric VSMCs.

The left graphs show recordings illustrating the effects of two different BaCl2 concentrations (30 and 100 μm, A) and 100 μm pinacidil and 20 μm glibenclamide (B) in representative BPN and BPH cells. Both resting VM and the amplitude of the drug-induced changes are clearly different between BPN and BPH cells. These differences were consistent and significant, as shown in the summary data on the bar graphs. n= 9–18 cells in each group, Student's unpaired t test. The inset in B (horizontal bar plot) shows the fraction of KATP channels that are open at resting membrane potential, calculated as 100 ×ΔVM,glibenclamide/(ΔVM,glibenclamide+ΔVM,pinacidil). Each value is the mean ± SEM of 18 (BPN) and 16 (BPH) cells. **P < 0.01, ***P < 0.001
