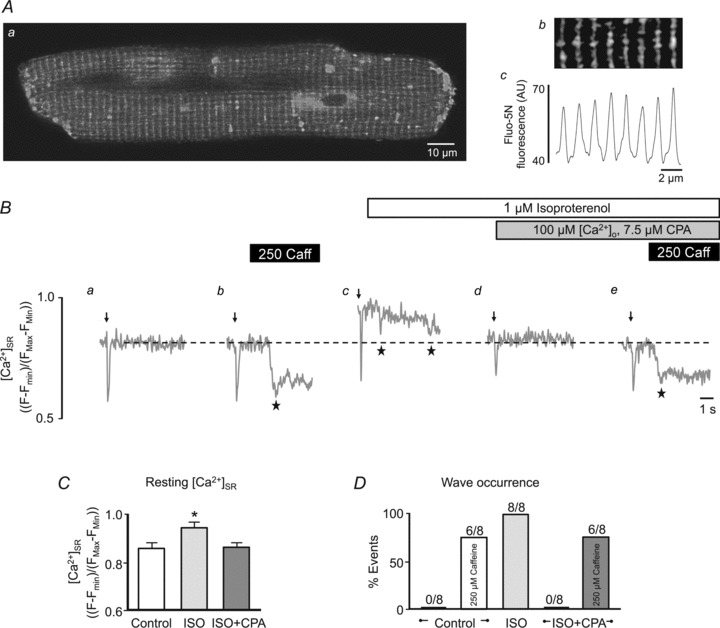
Figure 2. Direct [Ca2+]SR measurements following isoproterenol application.

A, confocal fluorescence image (a) of a myocyte with the SR loaded with the low-affinity Ca2+ indicator fluo-5N. Enlarged region of image (b) and corresponding fluorescence profile (c) showing patterning of the junctional SR network. AU, arbitrary units of fluo-5N fluorescence. B, example [Ca2+]SR measurements with fluo-5N fluorescence showing an electrically induced Ca2+ depletion (arrow, 0.75 Hz) followed by rest under control conditions (a and b), in the presence of ISO (c) (a–c: [Ca2+]o= 2 mm), and in the presence of ISO with 7.5 μm CPA in 100 μm[Ca2+]o (d and e). In traces b and e 250 μm caffeine (250 Caff) was applied to pharmacologically sensitize RyRs and induce Ca2+ waves. Ca2+ waves are visible in fluo-5N fluorescence profiles as a non-triggered decrease in fluorescence (stars). Summary data of resting [Ca2+]SR (C) and Ca2+ wave occurrence (D) under the conditions shown in B. Ca2+ wave occurrence is presented as fraction (%) of cells showing waves, from a total of eight cells. *P < 0.05.
